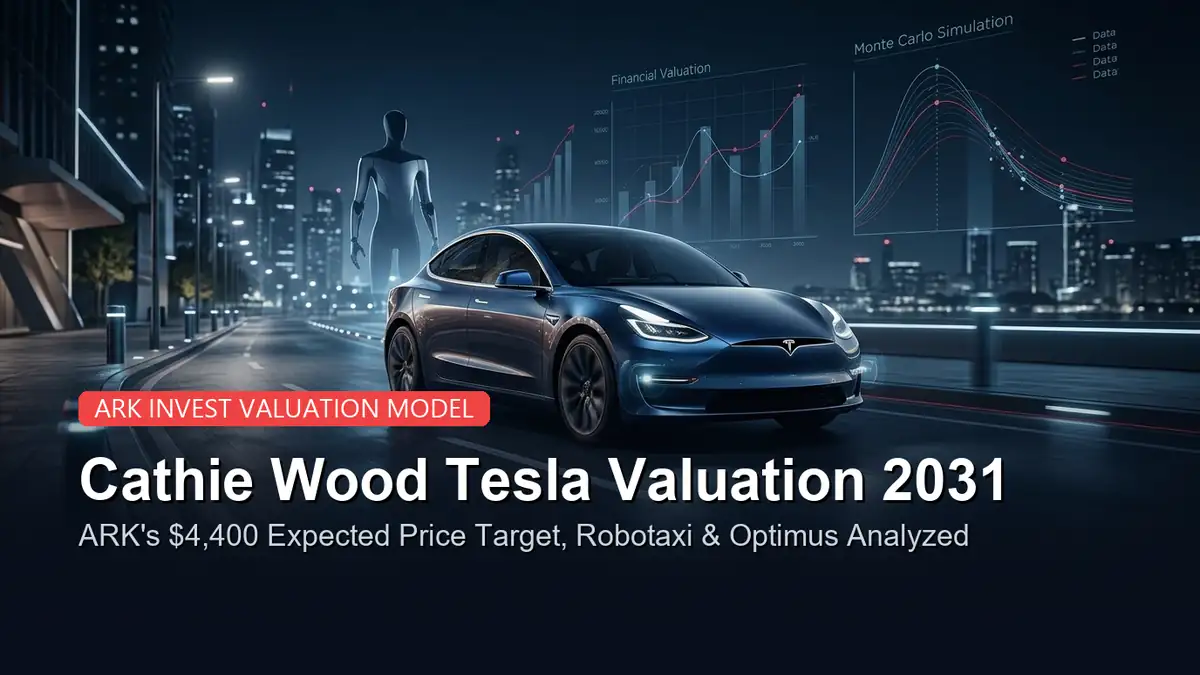
In the high-stakes arena of global technology investing and disruptive innovation, few financial forecasts have triggered as much intense debate, Wall Street skepticism, and retail enthusiasm as ARK Invest’s multi-trillion-dollar valuation models for Tesla, Inc. (NASDAQ: TSLA). Under the leadership of founder and Chief Investment Officer Cathie Wood and director of investment analysis Tasha Keeney, ARK Invest published an updated open-source research model projecting that Tesla’s stock price could reach an astonishing $4,400 per share by 2031 in its expected baseline case. Consequently, search queries for “cathie wood tesla valuation 2031”, “ARK Invest Tesla $4400 target”, and “how does ARK calculate Tesla robotaxi valuation?” have surged across global financial networks and equity forums.
If realized, ARK’s $4,400 per share target would catapult Tesla’s market capitalization to approximately $16.4 Trillion—a valuation surpassing the combined market capitalization of Microsoft, Apple, NVIDIA, Alphabet, and Amazon combined today. While traditional Wall Street auto analysts evaluate Tesla primarily as a car manufacturer—forecasting quarterly vehicle delivery counts, automotive gross margins, and factory retooling costs—ARK views Tesla fundamentally as an artificial intelligence, autonomous robotics, and distributed energy conglomerate.
What specific mathematical inputs drive this astronomical figure? How does ARK’s probabilistic Monte Carlo computer simulation work? Why do autonomous ride-hailing “Robotaxis” represent over 80% of Tesla’s future projected enterprise value? And what critical regulatory, technological, and manufacturing hurdles could derail this valuation thesis? In this comprehensive, research-backed guide, SharePriceHub deconstructs ARK Invest’s 2031 Tesla valuation model. We explain the Monte Carlo methodology, analyze the unit economics of the Cybercab autonomous ride-hail network, examine supercomputing training clusters (Cortex / Dojo), evaluate Tesla’s Megapack energy storage trajectory, examine the Optimus humanoid robotics optionality, contrast Vision-only autonomy against Waymo’s LiDAR suite, and deliver a balanced, institutional scenario audit for global investors.
1. Quick Summary: ARK Invest’s Tesla 2031 Price Scenarios
ARK Invest rejects single-point price targets, arguing that dynamic innovation cannot be captured by static linear spreadsheets. Instead, ARK’s research team (Tasha Keeney, Daniel Maguire) models a wide probabilistic distribution across three primary operating scenarios:
| Simulation Scenario | Projected 2031 Share Price | Implied Enterprise Value (EV) | Statistical Simulation Parameter & Assumptions |
|---|---|---|---|
| Bear Case Scenario | $3,300 per share | $12.5 Trillion | 25th percentile outcome; slower FSD regulatory approvals; partial Robotaxi deployment; higher battery manufacturing costs. |
| Expected Value (Base Case) | $4,400 per share | $16.4 Trillion | Median/mean outcome; nationwide commercial Robotaxi launch; rapid unboxed EV manufacturing; Megapack scaling. |
| Bull Case Scenario | $5,000 per share | $19.2 Trillion | 75th percentile outcome; global Robotaxi dominance; rapid commercialization of Optimus humanoid robots in manufacturing. |
| Current Market Price Baseline | ~$386 – $420 per share | ~$1.2 Trillion – $1.3 Trillion | Current trading price band across late October 2026 trading sessions. |
| Implied Growth Multiplier | ~10.5x to 11.4x Expansion | +$15.1 Trillion Value Creation | Requires an annualized compound growth rate (CAGR) of ~52% to 58% p.a. over 5 years. |
2. How ARK Calculates Its Estimate: The Monte Carlo Model Explained
Traditional equity analysts typically project revenue out three years, multiply by an estimated earnings margin, and apply a Price-to-Earnings (P/E) multiple. ARK argues that this method fails completely for exponential technology platforms characterized by Wright’s Law cost declines and network effects. To overcome this, ARK created an open-source Monte Carlo Simulation Model (publicly accessible on ARK’s GitHub repository):
1. What Is a Monte Carlo Simulation?
Imagine rolling a complex pair of 32-sided dice thousands of times. In a Monte Carlo simulation, the computer program assigns probabilistic probability distributions to 32 key operational and economic variables—such as battery cell cost per kilowatt-hour, autonomous vehicle accident rates per million miles, ride-hailing take rates, and regulatory approval timelines. The program executes tens of thousands of simulated trials, where each trial pulls a random combination of inputs, generating a bell-curve distribution of possible 2031 share prices.
2. The 32 Key Input Variables Modeled
- Autonomous Software & Safety: Commercial launch date for driverless Full Self-Driving (FSD), critical disengagement frequency, and regulatory approval velocity across key US states and European jurisdictions.
- Vehicle Cost Curves (Wright’s Law): Cumulative production doubling rates driving battery pack costs below $65/kWh and total vehicle cost of goods sold (COGS) below $18,000 via the “unboxed” modular assembly process.
- Ride-Hail Network Economics: Consumer platform adoption rates, price charged per vehicle mile ($0.25 vs $2.00 for human-driven Uber), Tesla’s platform take-rate percentage, and vehicle asset utilization hours per day.
- Energy Storage Compounding: Annual Megapack utility storage gigawatt-hour (GWh) deployment rates, software monetization via Autobidder, and gross margins on grid-scale stationary batteries.
3. The Core Value Driver: Why Robotaxi Represents 85% of the Model
The single most crucial insight for investors reading ARK’s research is this: In ARK Invest’s model, Tesla is NOT valued as an automotive company. Autonomous Robotaxis account for approximately 64% of total enterprise value and an astounding 85% of projected 2031 EBITDA.
| Business Segment in ARK 2031 Model | Projected 2031 Annual Revenue | Projected 2031 EBITDA | Percentage of Total Enterprise Value |
|---|---|---|---|
| Autonomous Robotaxi Fleet (Cybercab) | $950 Billion – $1.15 Trillion | $620 Billion – $750 Billion | ~85% of Projected Enterprise Value |
| Electric Vehicle (EV) Hardware Sales | $320 Billion – $390 Billion | $65 Billion – $85 Billion | ~10% of Projected Enterprise Value |
| Stationary Energy Storage (Megapack/Powerwall) | $110 Billion – $145 Billion | $25 Billion – $35 Billion | ~4% of Projected Enterprise Value |
| Optimus Humanoid Robots & FSD Licensing | Unmodeled / Pure Upside Option | Unmodeled / Pure Upside Option | ~1% (Modeled primarily as upside optionality) |
The Revolutionary Unit Economics of Autonomous Ride-Hailing
Why is autonomous ride-hail so extraordinarily profitable compared to manufacturing cars? The answer lies in replacing human labor with software:
- Human-Driven Ride-Hail Cost: Today, an Uber or Lyft ride in major US metropolitan areas costs consumers approximately $2.00 to $2.50 per mile, with roughly 70% to 75% of that fare compensating the human driver for their time, vehicle depreciation, and gasoline.
- Tesla Robotaxi Projected Cost: By removing the steering wheel, pedals, and human driver, and powering the vehicle with low-cost solar electricity via dedicated charging hubs, Tesla projects operating costs of approximately $0.20 to $0.25 per mile.
- Consumer Pricing & High Take-Rate: Tesla can charge consumers $0.70 to $0.90 per mile—undercutting Uber and personal car ownership by 60%—while capturing a massive 50% to 70% gross operating margin. Furthermore, on customer-owned Teslas enrolled into the shared autonomous fleet, Tesla plans to charge a 20% to 30% platform software fee, mirroring Apple’s App Store economics.
4. The AI Brain: Cortex Supercluster, Dojo & Neural Network Training
What gives Tesla the technological confidence that it can solve autonomous driving without expensive LiDAR sensors? The answer lies in its massive, real-world fleet data advantage and frontier AI training supercomputing infrastructure:
- 6+ Million Customer Vehicles on Road: Unlike Waymo, whose autonomous fleet numbers under 2,000 specialized vehicles, Tesla has over 6 million customer vehicles worldwide gathering billions of real-world driving miles every single month across diverse weather, lighting, and road conditions.
- End-to-End Neural Networks (FSD V12 / V13): Tesla completely replaced hundreds of thousands of lines of explicit C++ heuristic code with end-to-end neural networks. Video photons from eight 5-megapixel cameras enter the network, and driving controls (steering torque, acceleration, braking) output directly, learning human-like intuition from millions of video clips of elite drivers.
- Gigawatt-Scale Compute (Cortex Supercluster): At Giga Texas, Tesla built the “Cortex” supercomputing cluster, deploying over 50,000 to 100,000 NVIDIA H100 and Blackwell B200 AI GPUs alongside custom Tesla Dojo D1/D2 silicon processors, providing the astronomical compute required to train generative video foundation models for full autonomy.
5. The Physical Foundation: Unboxed EV Manufacturing & Megapacks
While autonomous software provides astronomical profit margins, Tesla’s physical manufacturing capabilities provide the scalable hardware foundation:
1. The “Unboxed” Modular Manufacturing Architecture
Traditional automotive assembly lines (pioneered by Henry Ford) operate sequentially: a single stamped steel body moves along a linear track while workers and robots cram components inside the cabin through door openings. Tesla’s proprietary Unboxed Process breaks the vehicle into modular sub-assemblies (front casting, rear casting, structural battery pack floor, interior seats, and painted side panels) built simultaneously in parallel sub-stations before coming together in one final modular docking:
- Factory Footprint Reduction: Reduces physical factory floor space by over 40%, allowing Giga factories to produce significantly higher vehicle volumes per square meter of capital investment.
- Manufacturing Labor & Time: Reduces total factory labor hours by up to 30%, driving the manufacturing cost of Tesla’s Next-Generation platform (Cybercab / Model 2) down to $17,000 to $20,000 per unit.
2. Energy Storage: The 100 GWh Megapack Empire
Often overlooked by automotive analysts, Tesla Energy is experiencing exponential compounding. As renewable wind and solar power flood electrical grids worldwide, utility companies require massive utility-scale stationary batteries to stabilize grid frequencies and store surplus daytime solar electricity:
- Lathrop & Shanghai Megafactories: Tesla operates dedicated Megafactories in Lathrop, California, and Shanghai, China, each capable of producing 40 GWh (10,000 Megapack units) annually.
- High Margins & Software Recurring Revenue: Unlike electric cars subject to cutthroat consumer price wars, utility Megapacks command stable 25% to 30% gross margins. Refined by Tesla’s proprietary Autobidder energy trading algorithmic software, utilities generate automated arbitrage revenues by buying cheap off-peak power and discharging battery electricity during peak grid pricing spikes.
6. Optimus Humanoid Robotics: The Multi-Trillion Dollar Wildcard
In recent shareholder meetings, Tesla CEO Elon Musk asserted that the Optimus general-purpose humanoid robot will eventually become more valuable than Tesla’s automotive and autonomous driving businesses combined. How does ARK treat Optimus?
Remarkably, in ARK’s baseline $4,400 price target model, Optimus is largely excluded from baseline revenue forecasts or assigned conservative pilot testing valuations. ARK treats humanoid robotics as a free call option. If Tesla successfully scales Optimus—deploying thousands of autonomous robots to perform tedious, hazardous, or repetitive assembly tasks inside its own Gigafactories before leasing them to third-party industrial warehouses—global manufacturing labor economics will be fundamentally redefined:
- $20,000 Bill of Materials: Leveraging Tesla’s in-house electric motor design, battery pack packaging, actuator engineering, and FSD visual neural networks, Tesla aims to manufacture Optimus robots for under $20,000 per unit.
- $3 to $5 Hourly Operating Cost: An Optimus robot operating 16 hours daily requires approximately $3 to $5 per hour in electricity and maintenance depreciation—vastly cheaper than human factory labor ($25 to $45/hr in North America and Western Europe).
- Unmodeled Upside: If commercial humanoid robotics achieves scale by 2031, ARK estimates it could add an additional $5 Trillion to $10 Trillion in enterprise value beyond the $4,400 baseline.
7. Critical Wall Street Skepticism: What Could Derail ARK’s Forecast?
While ARK’s mathematical simulation is logically consistent within its own assumptions, institutional short sellers, traditional automotive analysts, and academic researchers point out massive real-world execution risks:
| Critical Risk Factor | ARK Model Assumption | Real-World Counter-Argument & Obstacle |
|---|---|---|
| 1. FSD Regulatory Approval | Commercial driverless robotaxis approved across major US states by 2026–2027. | Severe Regulatory Scrutiny: The National Highway Traffic Safety Administration (NHTSA) and state DMVs (California, Texas) mandate exhaustive safety validations; legal liability in fatal crashes remains unresolved. |
| 2. Vision-Only vs LiDAR Architecture | End-to-end visual neural networks (cameras alone) solve level 4/5 full autonomy. | Sensor Redundancy Concerns: Competitors like Alphabet’s Waymo use redundant multi-sensor suites (LiDAR, Radar, Cameras). Vision-only systems face edge-case limitations in blinding glare, heavy fog, and severe blizzards. |
| 3. Valuation Sanity Check | Tesla command an enterprise value of $16.4 Trillion by 2031. | Macro Multi-Trillion Scale: A $16.4T market cap would represent roughly 12% to 15% of total US GDP, requiring an extreme concentration of capital in a single corporate equity. |
| 4. Brutal EV Price Wars & China Competition | Tesla maintains 20%+ automotive margins and scales to 10M+ annual deliveries. | Chinese EV Giants: Manufacturers like BYD, Xiaomi, and Geely produce compelling $15,000 to $25,000 EVs with domestic battery vertical integration, compressing international market share. |
| 5. Key-Person Risk (Elon Musk) | Elon Musk remains deeply focused on executing Tesla’s engineering roadmap. | Executive Distraction: Musk divides leadership across SpaceX, xAI, Neuralink, and X (formerly Twitter), creating governance friction and succession uncertainty. |
8. Real-World Fundamental Reality Check: Q3 2026 Operational Performance
To ground ARK’s long-term computer model in empirical reality, we benchmark its assumptions against Tesla’s actual audited operating results recorded in late 2026:
| Operational & Financial Metric | Actual Reported Quarterly Results (Late 2026 Run-Rate) | ARK 2031 Model Annual Requirement |
|---|---|---|
| Quarterly Vehicle Deliveries | ~470,000 – 495,000 vehicles (~1.9M annualized) | ~10,000,000 to 14,000,000 vehicles annually |
| Automotive Gross Margin (Ex-Credits) | ~16.5% – 17.8% | ~28.0% – 32.0% (Powered by unboxed manufacturing) |
| Energy Storage Deployments | ~6.9 to 7.5 GWh per quarter (~28 GWh annualized) | ~250 to 350 GWh annually |
| Commercial Robotaxi Rides Delivered | 0 Commercial Driverless Rides (Testing Only) | Hundreds of billions of passenger miles annually |
| Annualized Free Cash Flow (FCF) | ~$8.5 Billion – $11.0 Billion | ~$400 Billion – $550 Billion annually |
This comparison reveals the immense leap required: Tesla’s core car and energy business is fundamentally profitable and growing, but achieving ARK’s $4,400 share price target requires an unprecedented technological breakthrough from driver-assisted software (Level 2) to fully autonomous driverless network dominance (Level 4/5).
9. Scenario Valuation Models: SharePriceHub Multi-Tier Projections (2026–2031)
To provide investors with balanced institutional risk modeling, SharePriceHub synthesizes ARK’s bullish simulation with traditional Wall Street fundamental constraints across three realistic scenarios:
| Scenario Parameter | Conservative Bear Case (Car & Energy Company) | Realistic Base Case (Hybrid Autonomy & Energy) | ARK-Style Bull Case (Global Robotaxi Monopoly) |
|---|---|---|---|
| Robotaxi Commercialization | Severely delayed; restricted to limited geo-fenced pilots. | Successfully launched in 15+ US states; partial international rollouts. | Full nationwide deployment; tens of thousands of active Cybercabs. |
| Annual Vehicle Sales (2031) | 4.5 Million Vehicles | 7.5 Million Vehicles | 12.0 Million Vehicles |
| Energy Storage (2031) | 85 GWh / year | 175 GWh / year | 350 GWh / year |
| Consolidated Net Income (2031) | $28 Billion | $85 Billion | $380 Billion |
| Valuation Multiple Applied | 25.0x P/E Multiple | 35.0x P/E Multiple | 45.0x P/E Multiple (Tech Platform) |
| Projected Market Cap (2031) | $700 Billion | $2.97 Trillion | $17.1 Trillion |
| Projected Share Price (2031) | ~$220 per share | ~$920 per share | ~$4,400 per share |
| Annualized CAGR from $400 | -11.2% p.a. (Decline) | +18.1% p.a. | +61.5% p.a. |
10. Section 22 Opinion Block: Five-Tier Investor Matrix
How should technology investors, wealth builders, and retail traders manage their Tesla exposure in light of ARK’s valuation research? Review the strategic recommendations below:
| Investor Category | Strategic Recommendation | Actionable Operational Guidelines |
|---|---|---|
| 1. Long-Term AI & Tech Believers (5+ Years) | SYSTEMATIC ACCUMULATION | Treat Tesla as a venture-style call option on artificial intelligence and autonomous robotics. Allocate 3% to 7% of total portfolio equity, accumulating on macroeconomic dips. |
| 2. Existing Tesla Shareholders (Holding Stock) | HOLD WITH DISCIPLINED REBALANCING | If Tesla has grown to represent an oversized portion of your net worth (>20%), rebalance profits into diversified assets while retaining core exposure for autonomous upside. |
| 3. Value-Focused Fundamental Investors | EXERCISE CAUTION / UNDERWEIGHT | At ~60x trailing earnings, Tesla is priced for perfection. Value investors should wait for significant price pullbacks toward the $250 to $300 support corridor before initiating entry. |
| 4. Short-Term Momentum & Options Traders | TRADE THE CATALYST CALENDAR | Trade around defined event catalysts: quarterly earnings calls, autonomous Cybercab regulatory filings, and annual shareholder meetings. Strict stop-losses are non-negotiable. |
| 5. Conservative Retirement & Dividend Investors | AVOID INDIVIDUAL EQUITY HOLDINGS | Tesla pays zero dividends and reinvests all cash into capital expenditure. Conservative investors should capture Tesla exposure indirectly through broad market index funds (S&P 500 / NASDAQ 100). |
11. Frequently Asked Questions (FAQ)
What is Cathie Wood and ARK Invest’s price target for Tesla by 2031?
In its updated open-source Monte Carlo simulation model, ARK Invest projects an expected baseline share price target of $4,400 per share by 2031, with a Bear case of $3,300 and a Bull case of $5,000 per share.
What would Tesla’s total market value be at $4,400 per share?
At $4,400 per share, Tesla’s enterprise valuation would reach approximately $16.4 Trillion, making it the most valuable publicly traded company in world history.
Why does Robotaxi matter so much in ARK’s Tesla valuation?
In ARK’s simulation, autonomous ride-hailing accounts for approximately 85% of Tesla’s projected 2031 operating profit (EBITDA), transforming Tesla from a capital-intensive automaker into a high-margin software platform.
How does a Monte Carlo simulation work in stock valuation?
A Monte Carlo simulation tests tens of thousands of random combinations across dozens of variable inputs (such as battery costs, accident rates, and regulatory timelines) to generate a probabilistic bell-curve distribution of future share prices.
What is the difference between Tesla’s Vision approach and Waymo’s autonomy?
Tesla uses cameras and neural networks alone (Tesla Vision) to navigate any road dynamically. Waymo uses a redundant sensor suite including expensive LiDAR, Radar, and high-definition pre-mapped geographic boundaries (geo-fencing).
What is Tesla’s “Unboxed” manufacturing process?
The Unboxed process breaks vehicle assembly into separate modular components built in parallel sub-assemblies before a single final docking, reducing factory floor space by 40% and cutting manufacturing costs by up to 30%.
Does ARK Invest’s $4,400 target include Optimus humanoid robots?
No. ARK’s baseline $4,400 target model largely excludes humanoid robotics or assigns only modest pilot testing revenues, treating Optimus as a multi-trillion-dollar upside call option.
How profitable is Tesla’s Megapack energy storage business?
Tesla Energy generates 25% to 30% gross margins on utility-scale Megapack battery installations, supplemented by recurring software fees from its Autobidder energy trading algorithm.
What are the main risks that could prevent Tesla from reaching $4,400?
Key risks include regulatory refusals to approve commercial driverless robotaxis, visual neural network edge-case failures, severe competition from low-cost Chinese EV manufacturers like BYD, and key-person risk surrounding Elon Musk.
What is Tesla’s Cortex supercomputer cluster?
Cortex is a massive AI training supercluster built at Giga Texas containing approximately 100,000 NVIDIA H100 and B200 AI GPUs designed to train Tesla’s Full Self-Driving video neural networks.
What is Tesla’s current vehicle delivery volume compared to ARK’s 2031 goal?
Tesla delivers approximately 1.9 million to 2.0 million vehicles annually as of late 2026, compared to ARK’s model requirement of 10 million to 14 million annual vehicle deliveries by 2031.
Does Tesla pay a dividend to shareholders?
No. Tesla does not pay a cash dividend. All operating cash flows are reinvested into AI datacenter infrastructure, Gigafactory expansions, and autonomous robotics R&D.
Where can investors view the raw code of ARK’s Tesla model?
ARK Invest publishes the open-source code and simulation parameters for its Tesla valuation models publicly on GitHub at github.com/ARKInvest.
What is SharePriceHub’s realistic base case price target for Tesla by 2031?
Under SharePriceHub’s balanced base-case model—assuming 7.5 million annual vehicle sales, 175 GWh energy storage, and partial robotaxi commercialization—Tesla commands a 2031 target of approximately $920 per share (~$2.97T market cap).
How much cheaper is a Robotaxi ride projected to be compared to Uber?
Operating a driverless electric robotaxi is projected to cost $0.20 to $0.25 per mile, allowing Tesla to charge consumers $0.70 to $0.90 per mile—over 60% cheaper than the $2.00 to $2.50 per mile charged by human-driven ride-hail services.
12. Important Statutory Disclaimers & Regulatory Notices
Educational and Informational Notice: This research dossier is published strictly for financial education, valuation methodology analysis, and investor awareness. SharePriceHub is an independent financial education portal and is not affiliated with, endorsed by, or representing Tesla, Inc., ARK Investment Management LLC, Cathie Wood, or NASDAQ.
No Financial Advice or Investment Solicitation: The valuation models, price targets, and simulation scenarios discussed herein are theoretical mathematical constructs based on third-party public research models. They do not constitute investment advice, buy/sell recommendations, or a guarantee of future equity returns. Equity markets and disruptive technology stocks carry extreme price volatility and substantial capital loss risks. Investors must conduct independent due diligence and consult a licensed financial advisor prior to making investment decisions.
Regulatory Compliance & Sourcing: Data points, quarterly financial metrics, and delivery figures are compiled from Tesla, Inc.’s official SEC Form 10-K and 10-Q filings, investor relations disclosures, and ARK Invest’s published research whitepapers. Historical computer simulation projections do not guarantee actual commercial market realization.